What Is a Good Click-Through Rate?
Surely everyone has heard that click-through rate is essential for displaying ads. This crucial indicator is an excellent way to measure the click count received by an already launched, active, and functioning online ad across the Internet. In essence, click-through percentage should be used in business promotion and that’s completely normal. It’s also employed by every publisher, advertiser, and marketer to assess the effectiveness of an advertising campaign.

What is a Click–Through Rate?
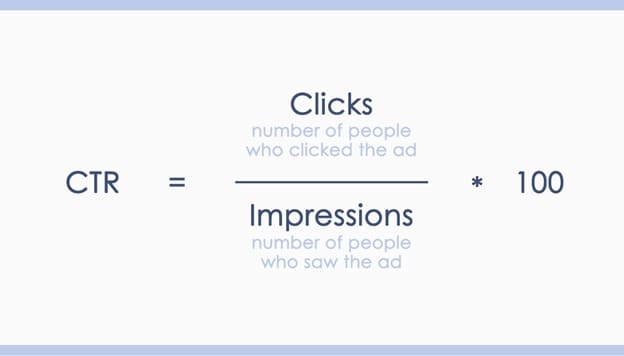
When it comes to the click-through rate in PPC, it’s important to remember the pace at which an interested Internet subscriber starts clicking on an ad. This figure represents a certain percentage of the target audience who view a specific ad (impressions) and then take the next action — clicking on the ad (generating clicks). Moreover, there’s a well-established click-through rate formula that helps determine whether an ad campaign has been successful. Using this longstanding formula, business owners can easily check their click rate via their PPC account dashboard. A high CTR indicates that a significant percentage of Internet users who saw a specific brand or company’s ad went on to click it.
What Is Considered a Good Click-Through Rate?
Today, a good CTR is around 1-5% meaning that the ratio of total clicks on a specific brand or company link to the number of impressions it generates corresponds to the average metric across all general measurements (e.g., 1 click per 2,000 impressions). The fact is, this average indicator reflects the click-through rate of the entire brand campaign, not just individual keywords. This shows that such a click-through percentage directly contributes to understanding which phrases, terms, or expressions help a business website rank best in the online space.
How to Calculate Click-Through Rate
As for the current formula, it’s been around for quite a while. The click ratio is calculated as follows: (click count ÷ number of impressions) × 100%. This vital metric helps brands and companies understand how effective a specific ad is or how much certain content grabs attention and motivates Internet users to click the link.
Average CTR Benchmarks Across Channels
When it comes to average values, a good click-through rate can vary depending on the online channel a business uses. For instance, digital display advertising, email campaigns, popular social media platforms, and video advertising — all come with their benchmarks. Understanding these details offers a valuable opportunity to assess how effective each channel could be for the business in the future.
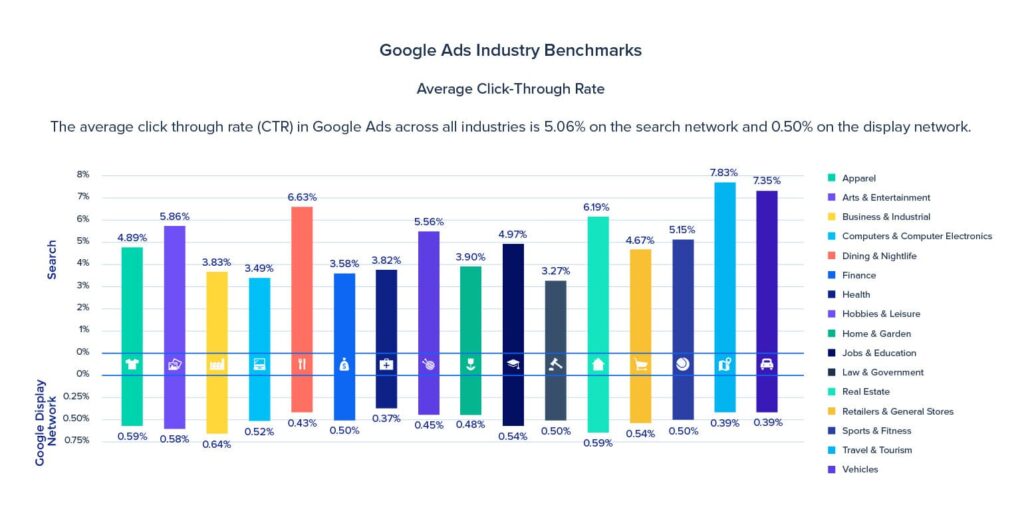
Google Ads CTR Benchmarks (Search vs. Display)
Currently, the circumstances are such that the click rate in Google Ads is typically higher in search results (by about 3 to 5 percent) compared to display ads (which often fall below 1%). This indicates that users are already interested in what’s being advertised and are even ready to take action.
Email Marketing CTR Benchmarks
The average click ratio in email marketing is around 2 to 5%. It’s important to keep in mind that this is quite a normal click-through rate, as it meets or even exceeds the industry average indicator of 1-5%. Naturally, a strong percentage also depends on the brand’s industry, the quality of the mailing list, and the relevance of the content. All of these factors can positively impact the likelihood of an email being clicked by each subscriber.
Video Ad CTR Benchmarks
As for the click-through rate in the video advertising format, it typically ranges from 0.5 to 2 percent. This is also considered a good CTR. However, achieving top performance in this format requires smart targeting and creative approaches to campaign strategy. The length of the video also plays a big role — the more engaging the video content is, and the clearer the call-to-action directed at the subscriber, the better the results for the business.
Social Media Platforms
CTR on popular social networks varies by platform. For example, Facebook and Instagram often see CTRs of around 0.9–1.6%, while LinkedIn can deliver even higher results (especially in B2B-focused campaigns). In these cases, everything depends on the quality of the visual content, a crafted headline, and of course, audience engagement. Only then will the average click-through rate start to improve.
How to Improve Click-Through Rate (CTR)
To improve CTR, experts always apply a holistic approach to promotion. This includes crafting relevant headlines and visual content that resonates with the audience. Through effective optimization, A/B testing, ad setup, and data analysis, it’s possible to significantly boost this metric.
Write Compelling Headlines
Using a clear, trustworthy, easy-to-digest headline is already half the battle won. It’s the first thing people see — and the reason they decide whether to engage. A good headline can directly increase CTR. Including keywords of varying frequency, numbers, and creative wording helps your business stand out from a sea of competitors.
Strong Calls-to-Action (CTAs)
To encourage online users to click on an ad, a business must use well-structured, engaging CTAs. This metric needs to be visible, seamlessly integrated, and aligned with the expectations of the audience. Only then will the message resonate enough to drive action.
Match Content with Audience Intent
Engaging and valuable content that aligns with user intent can significantly boost CTR. In addition, quality content enhances behavioral metrics. When your written and visual materials can answer questions or solve problems, it’s a major win for your business.
Enhance Visual Elements (Images and Thumbnails)
These interactive elements are crucial for tuning the audience’s visual perception of a brand or company. Naturally, they can positively influence click-through rates and boost CTR. To achieve this, businesses should use relevant, creative images and other interactive features that can strengthen emotional impact and engagement.
Experiment with Ad Copy (for PPC)
In this type of advertising, regular split testing is essential — the more often, the better. This approach helps identify what’s not working and allows timely changes to headlines, offers, or copy. Even minor adjustments to your content or ads can result in a noticeable increase in CTR.
Analyze and Adjust Based on Performance
Ongoing audits, monitoring, and performance analysis of your campaigns allow you to quickly understand what doesn’t interest your audience. When managing a business project, it’s vital to consistently run A/B tests and make prompt corrections, updates, and improvements. This is the only way to effectively increase CTR.
Average CTR Benchmarks Across Different Industries
CTR can vary significantly depending on the industry and niche. Understanding the average indicator for your specific field helps you make smarter, more objective assessments of campaign performance and ultimately supports the setting of more realistic business goals.
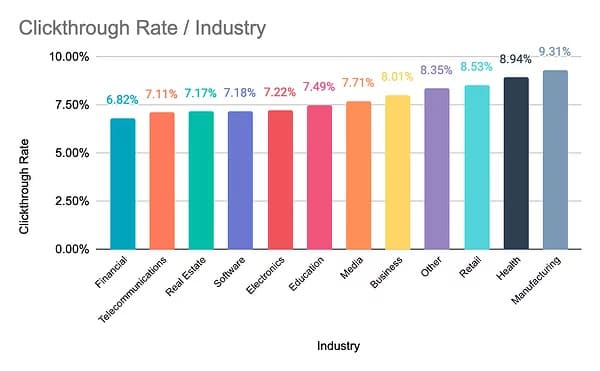
E-commerce Industry CTR Benchmarks
For a business that wants to grow in the digital space, it is important to develop relevant, up-to-date, interesting, and exciting content. Clear and compelling calls to action, a creative visual style, and valuable content all contribute to better performance and higher indicators.
Healthcare Industry CTR Averages
When it comes to content in the specialized healthcare field, it must be truthful, clear, and empathetic. People are seeking informative solutions to their problems. Authority, expertise, and transparency in advertising are highly valued here.
Finance and Insurance CTR Standards
In this sector, businesses must communicate their message. Audiences don’t trust vague promises. Customers are looking for strong, confident offers backed by credible sources.
Real Estate Industry CTR Metrics
In this “high-ticket” industry, geo-targeting is a must. High-quality images and simple, well-structured descriptions of properties play a key role. The success of a campaign largely depends on how current and relevant the offers are.
Technology and SaaS Industry CTR Insights
To promote tech IT solutions, you need to highlight the advantages of your web product. Showcase strengths with sharp headlines and transparent, easy-to-understand descriptions. Online users are looking for tools that solve their specific challenges.
Travel and Hospitality CTR Statistics
In the travel industry, emotion is everything. Inspire your audience with captivating visuals, enticing descriptions, and one-of-a-kind offers that promise dream getaways and unforgettable experiences. Photos from tourist places are also important.
Education Sector CTR Expectations
In education, compelling offers should communicate the value of the course, highlight student reviews, and clearly show growth opportunities post-training. The audience expects real benefits and future potential.
Automotive Industry CTR Comparisons
In this sector, strong visuals and emotionally resonant copy are essential. Showcase pricing, highlight the appeal of your offers, and emphasize overall accessibility to attract clicks and conversions.
Common Mistakes That Lower CTR
This indicator is one of the few indicators that demands constant attention. Keeping it at an average or high level is vital — otherwise, you risk wasting your campaign budget with poor returns. To avoid this, every campaign should be executed flawlessly.
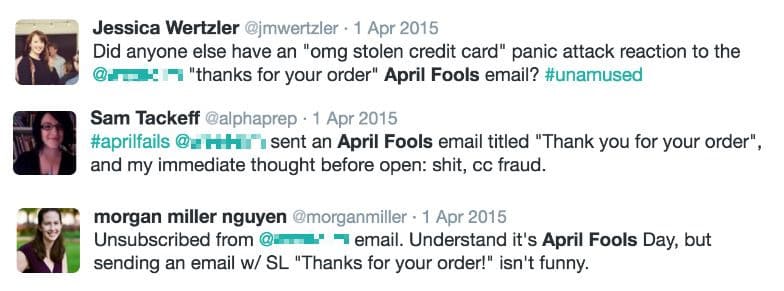
Misleading Ad Copy or Subject Lines
Incorrect or exaggerated headlines and content can mislead users. This undermines trust and causes them to leave, drastically lowering CTR. Always ensure your message is aligned with the offer.
Targeting the Wrong Audience
If your ads reach the wrong people, they simply won’t engage. This inevitably hurts CTR. Precision targeting is key to campaign success and higher engagement.
Poor Ad Placement or Email Design
Bad placement or unattractive visuals can ruin even the best offers. Unclear layouts, tiny fonts, or an overload of interactive elements can negatively impact the indicator and push users away.
Ignoring Data and Not Testing Variants
Split testing, data audits, and performance monitoring help reveal which elements work and which don’t. Timely content optimization and data-driven decisions are essential to improving your indicator and maximizing the effectiveness of your campaigns.
Differences Between CTR, Click Rate, and Click-to-Open Rate
These indicators differ from each other. When talking about CTR, a specific formula is used: clicks are divided by impressions, and the resulting number is multiplied by 100%. This metric helps evaluate the success of an advertisement in terms of audience reach.
When it comes to Click Rate, a different formula is applied. It calculates the percentage of clicks from the total number of delivered emails. That is, clicks are divided by delivered emails and then multiplied by 100%. This metric is used in email digital marketing to assess audience engagement.
There is also a Click-to-Open Rate. This formula shows how many people opened an email and clicked on a link. In other words, the number of clicks is divided by the number of opens, then multiplied by 100%. COR helps to understand how relevant the information in the email is and how strongly it motivates the audience to take action on the offer.
FAQs
What is a good click-through rate for Google Ads?
A solid result is typically considered to be a CTR of 4% or higher. That said, this indicator can vary depending on the industry, market competition, and the type of ad campaign you’re running.
How can I increase my CTR in email marketing?
To boost engagement, businesses should use catchy, easy-to-read subject lines. Personalizing content and including strong calls to action also helps. Split testing your emails can significantly increase your chances of success.
Why is my click-through rate low?
Several factors could be dragging your click-through rate down: weak or unattractive subject lines, irrelevant or unhelpful content, vague calls-to-action, poorly targeted audiences, or the wrong ad format. It’s also crucial to ensure fast website load times and full mobile optimization.
How does a high or low CTR affect my campaigns?
When users actively interact with your ads, it’s a clear sign they’re interested and engaged. On the flip side, if engagement is low or nonexistent, platforms may judge your ads as ineffective, which could negatively impact performance and visibility.

Ihor Volovoy